- Overview
- Status history
- Periods and root cause analyses
- Uptime
- Response times
- Response time distribution
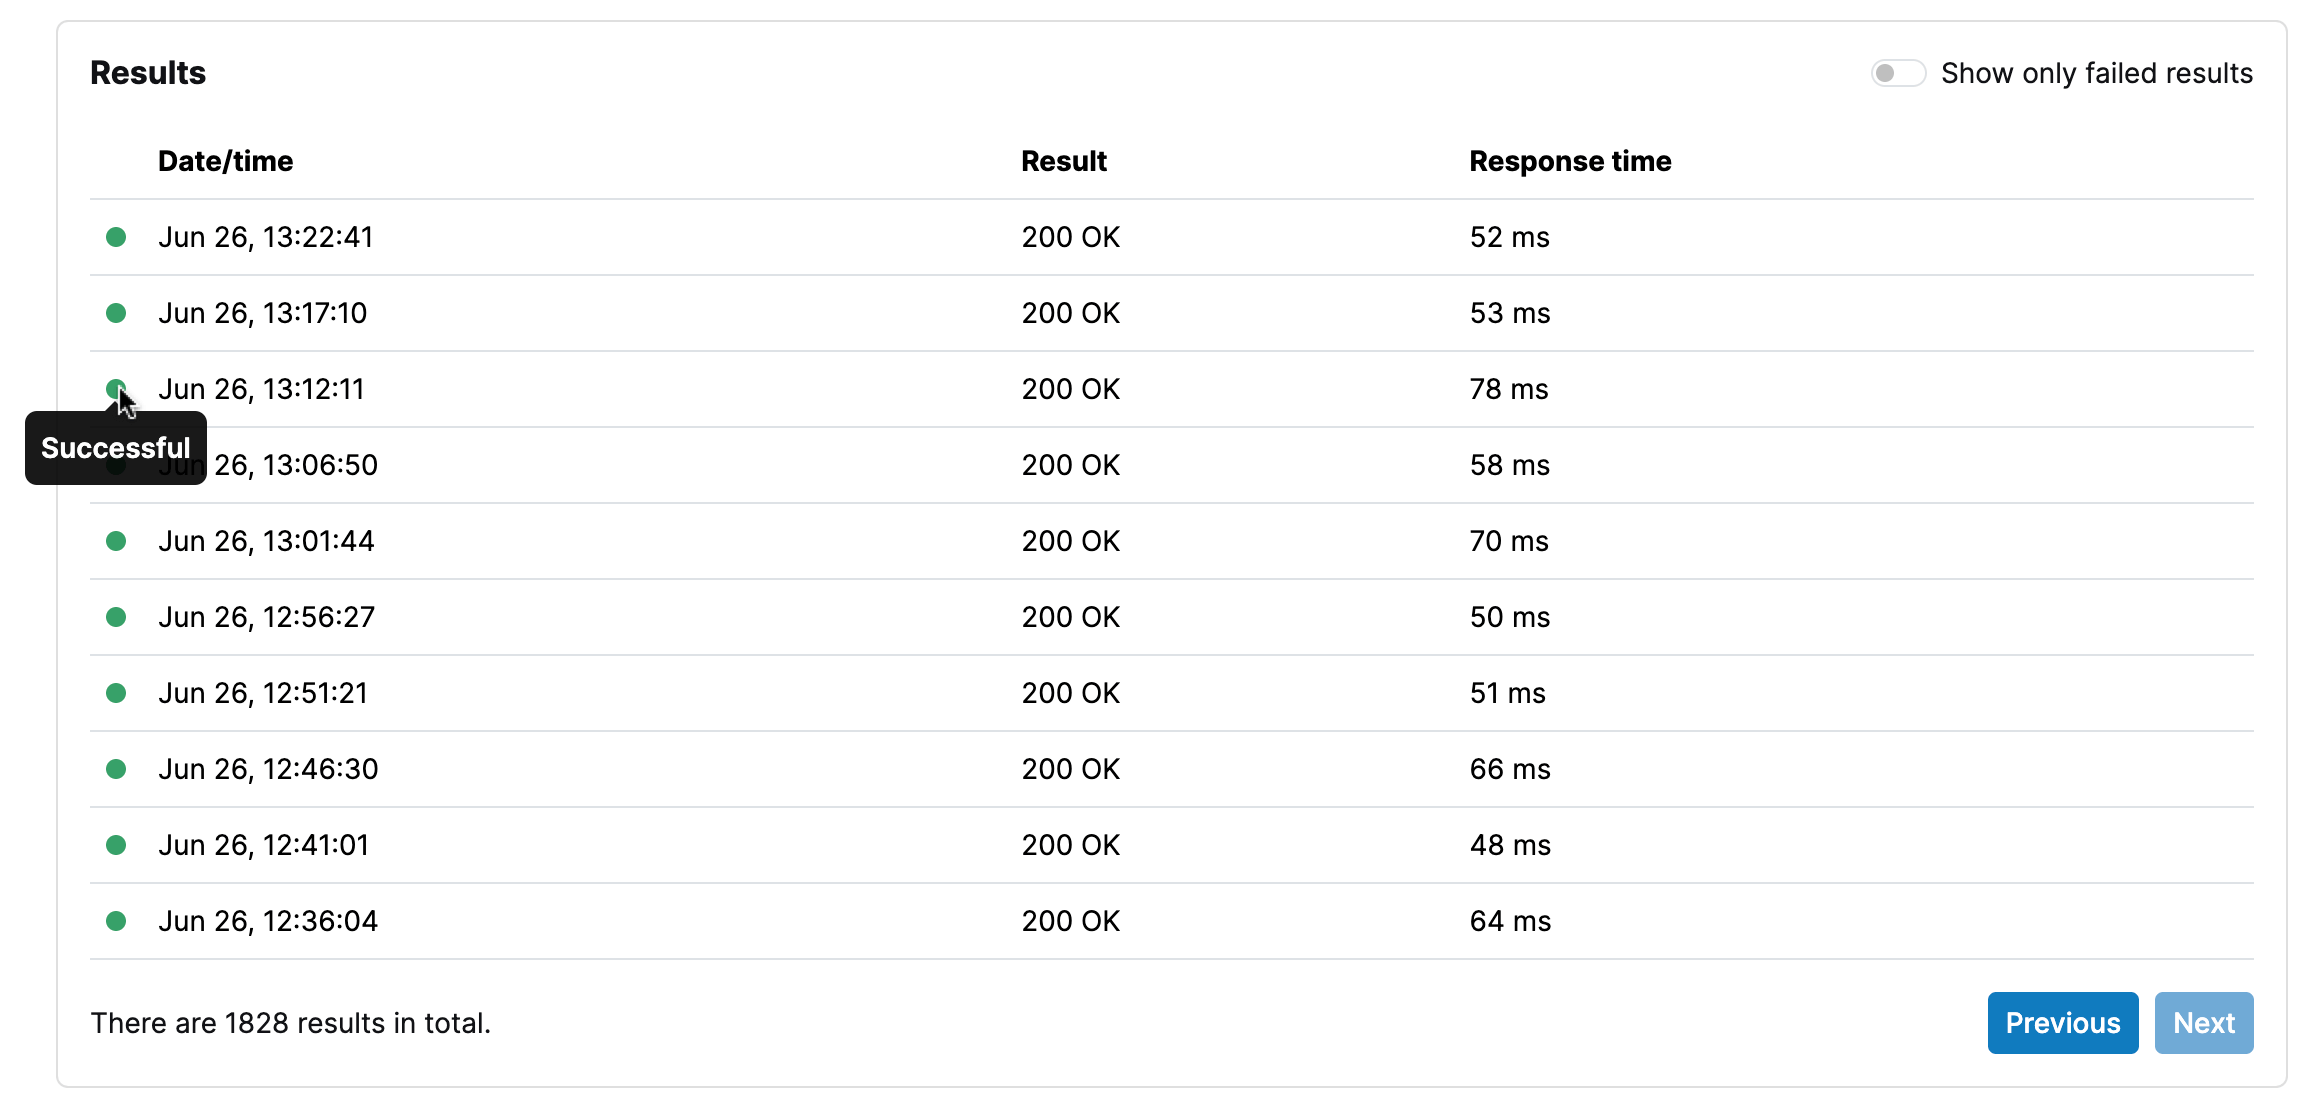
- Check results
HTTP monitor reports enable you to see historical analytics about the monitored services.
Here are the parts of the HTTP monitor reports:
- Overview
- Status history
- Response times
- Uptime
- Response time distribution
- Periods and root cause analyses
- Check results
Overview
Overview is the part you can see at the top of the HTTP monitor reports page. It provides a quick summary of the monitor and its report for the selected time window at a glimpse.

Status history
Status history provides a status timeline chart for the periods in the selected time window. To see details for a period, you can hover your cursor (or tap on mobile) on the relevant area.

Periods and root cause analyses
Periods table show the list of extents of time for all status updates for the selected time window.

Uptime
Uptime graph shows the uptime percentage values for selected time window.

Response times
Response times graph shows how long each stage of the request (name lookup, connect, TLS handshake, pre-transfer (wait), first byte) took, aggregated for the selected time window.

Response time distribution
Response time distribution is the histogram for total response times for the selected time window. In addition to averages on the response times, this graph gives you an idea about the variance.

Root cause analyses
When a downtime is detected, WebGazer collects information that is useful for identifying the issue, and provides that information as a root cause analysis. For details, please see here.
Check results
Results table show each individual check with its date and time, response status code and total response time (if available). The results are paginated, you can click the Previous button to see older checks.
