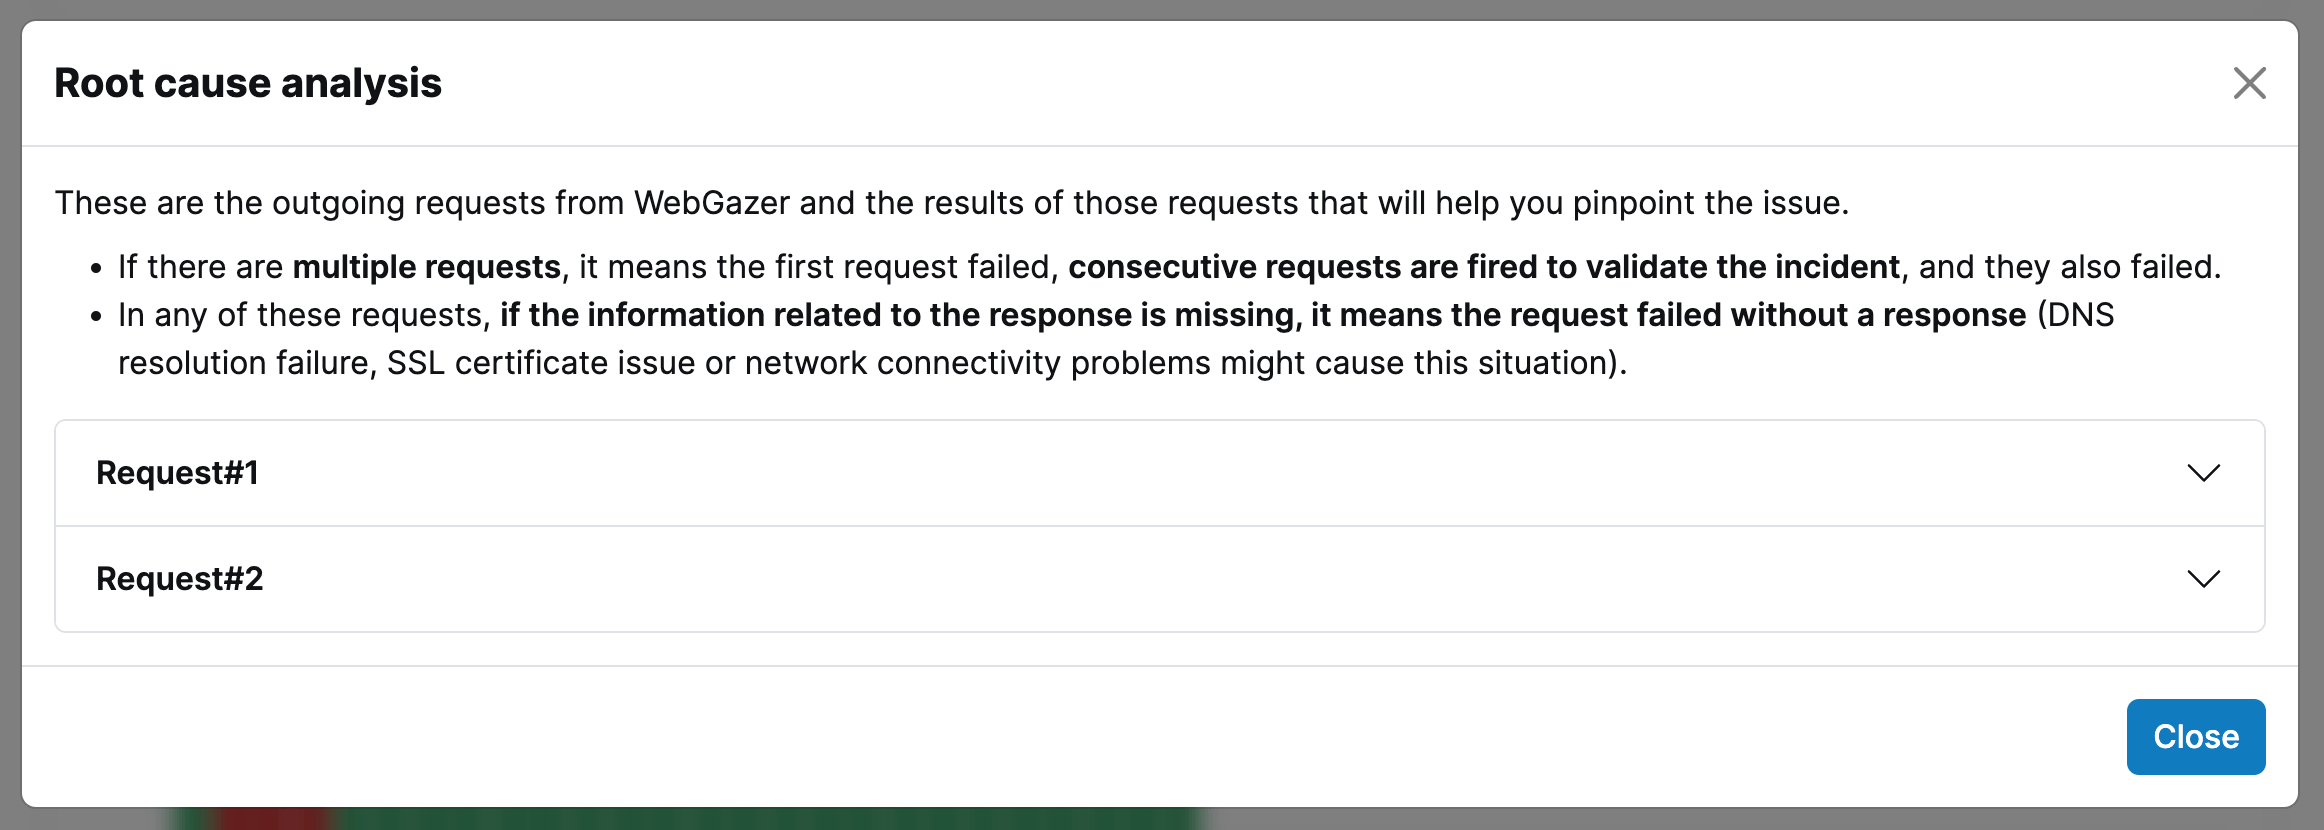
When a downtime occurs, WebGazer collects the information that will be helpful to pinpoint the issue. You can see this data in the root cause analysis.
When there is a period with the status Down, you will see a button on right side of that period's row. Click that button to open the root cause analysis.

A modal dialog with the list of requests will open. When WebGazer detects a downtime, to prevent false positives, it verifies the downtime with additional requests (You can read more about this behavior here). The requests you see here are the original request and the additional ones that are done to verify the downtime.

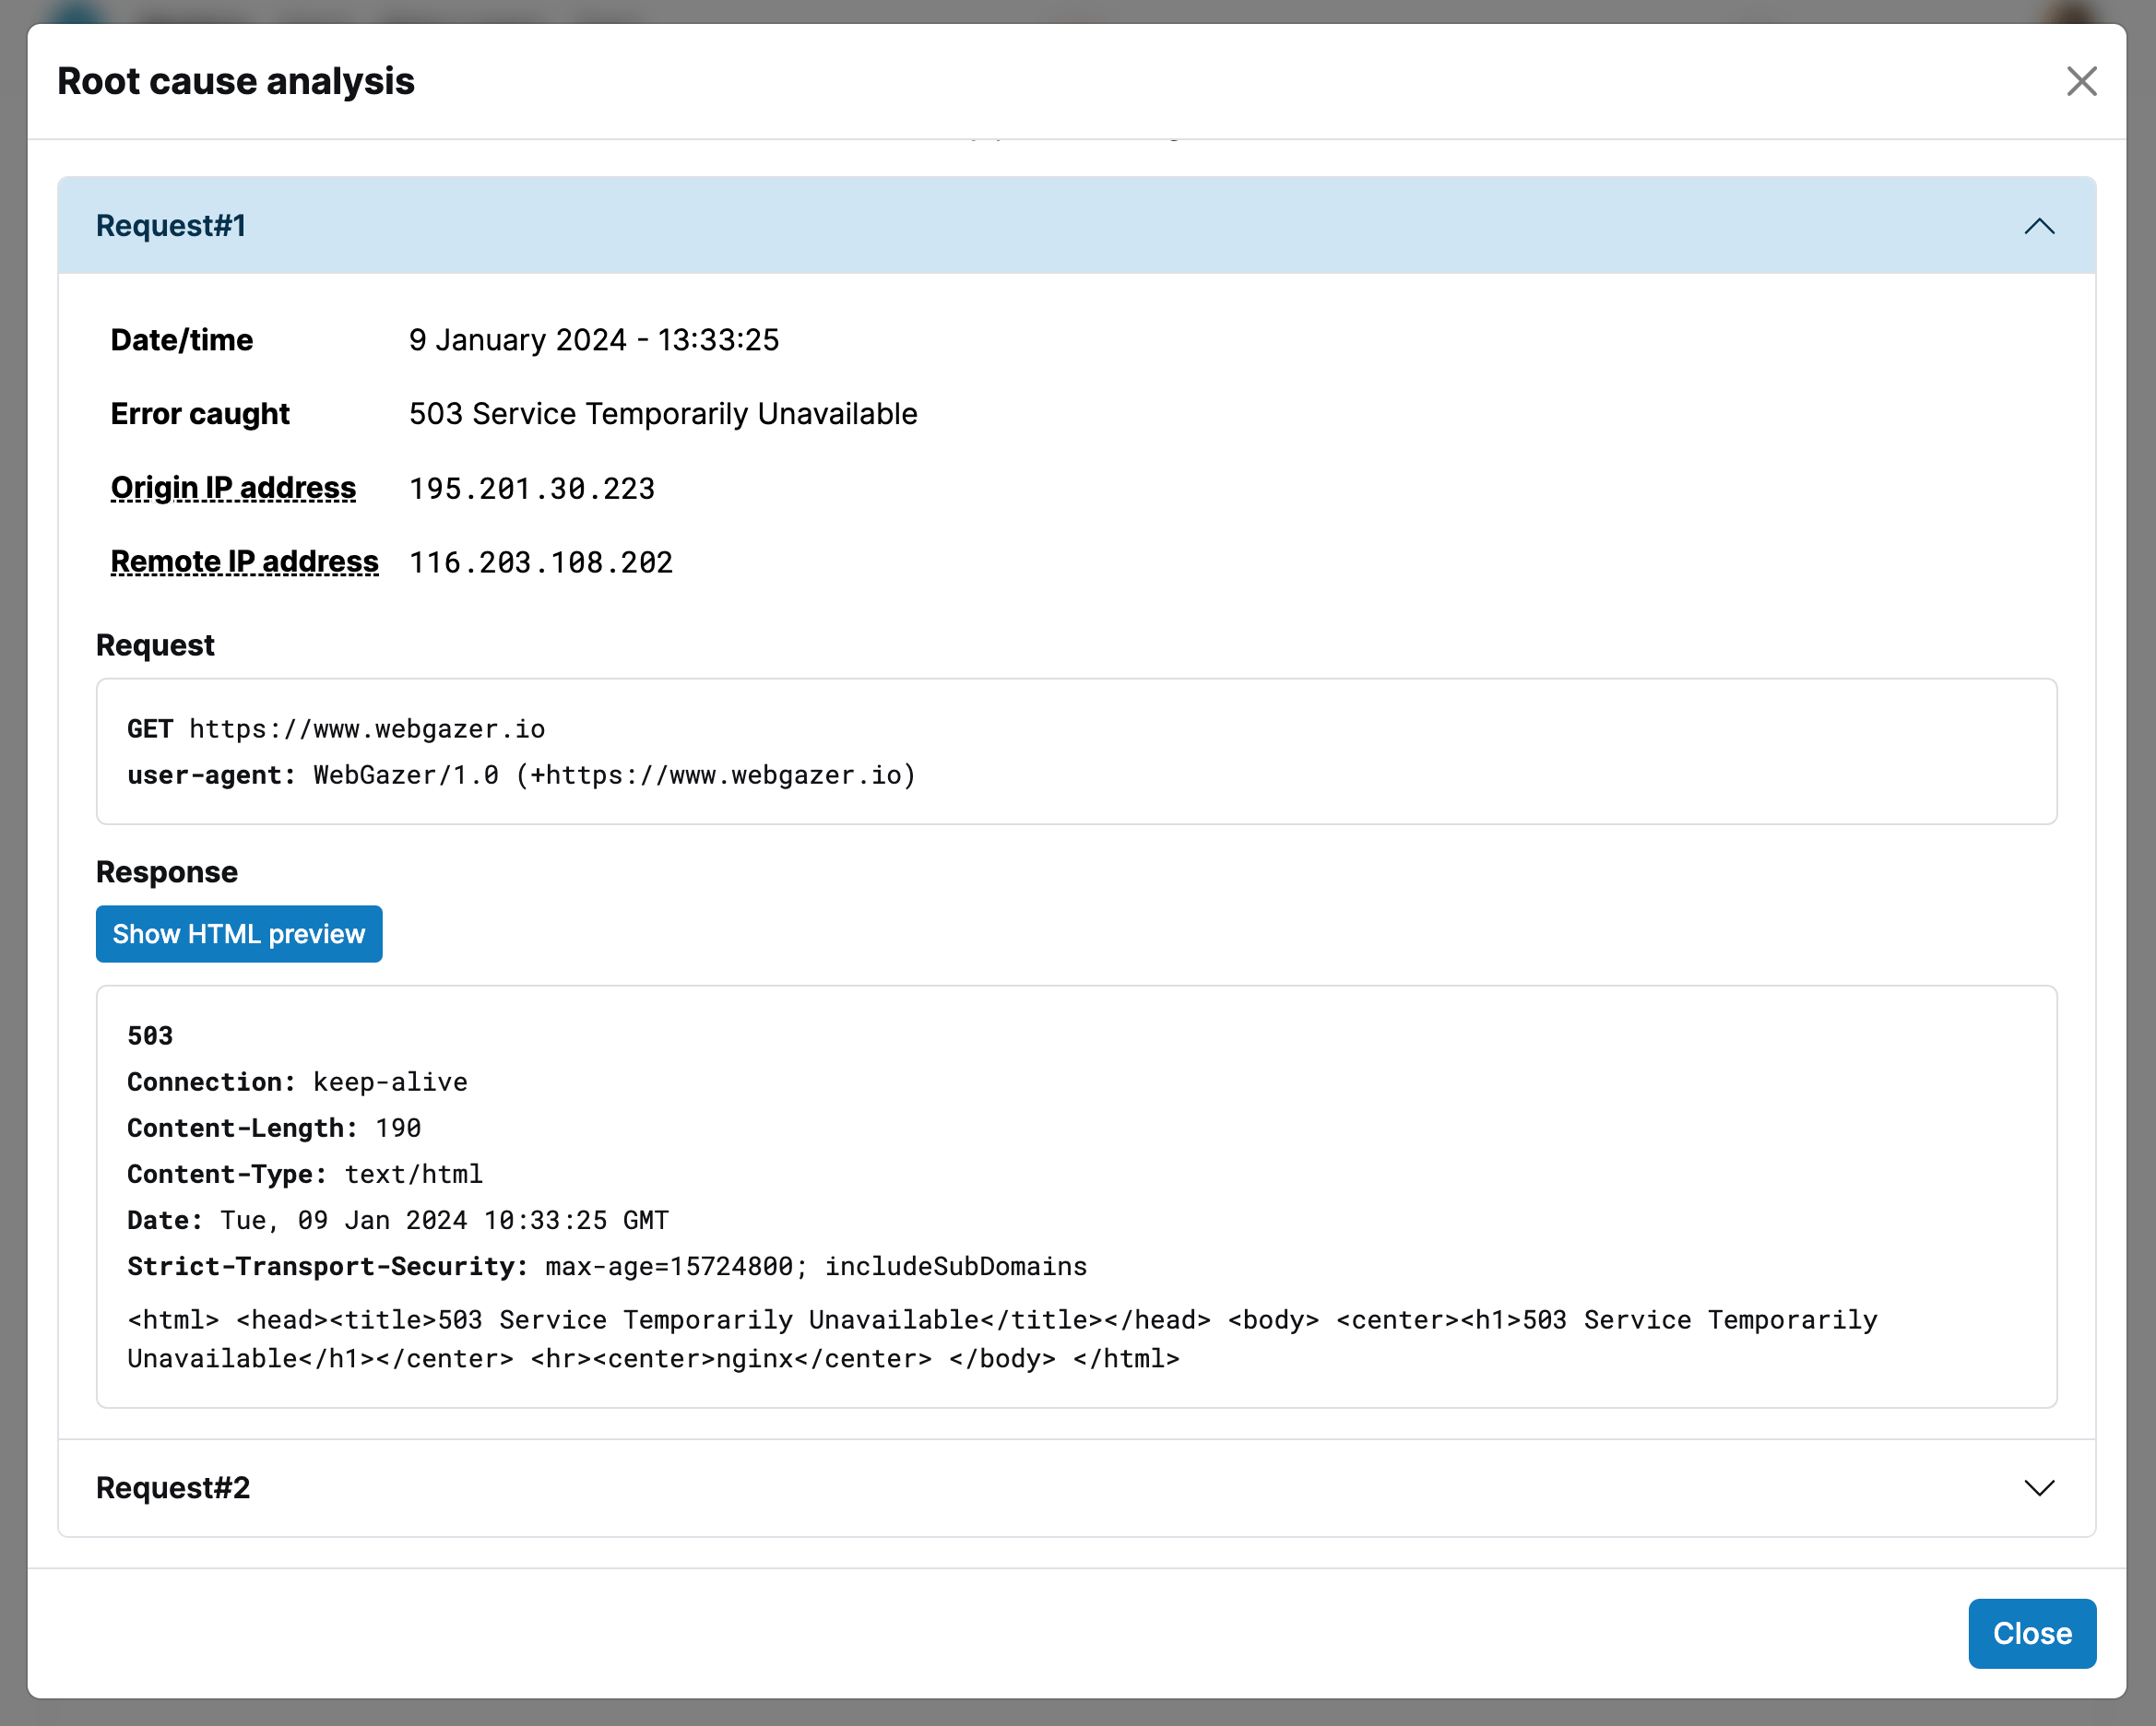
You can expand the details of a request by clicking it. Here you can see stuff like origin IP address (IP address of the WebGazer server), remote IP address (resolved IP address of the URL), request headers, body... If the server's response is in HTML, you can also click the Show HTML preview button to see what response looks like.
Response the server has returned is also displayed with the status code, headers and body. If you don't see anything related to the response, it means the check has failed without a response from the server. For example, issues like DNS resolution problems or connections timeouts result in a check failure without a response.
